Analysing Cat Hunting Behaviour
INFO 526 - Fall 2023 - Project 1
Understanding the Hunt: Cat Predatory Behavior
Dataset Description
Dataset is drawn from TidyTuesday
The Pet Cats data set comes from Movebank for Animal Tracking Data, collected from volunteers using GPS sensors on their pet cats around UK, US, Australia and New Zealand.
The dataset from US, UK, Australia, New Zealand have been merged to form a new data set which is used for plotting.
Q1. Are the cats which live together better at hunting than those which live alone?
Plot 1
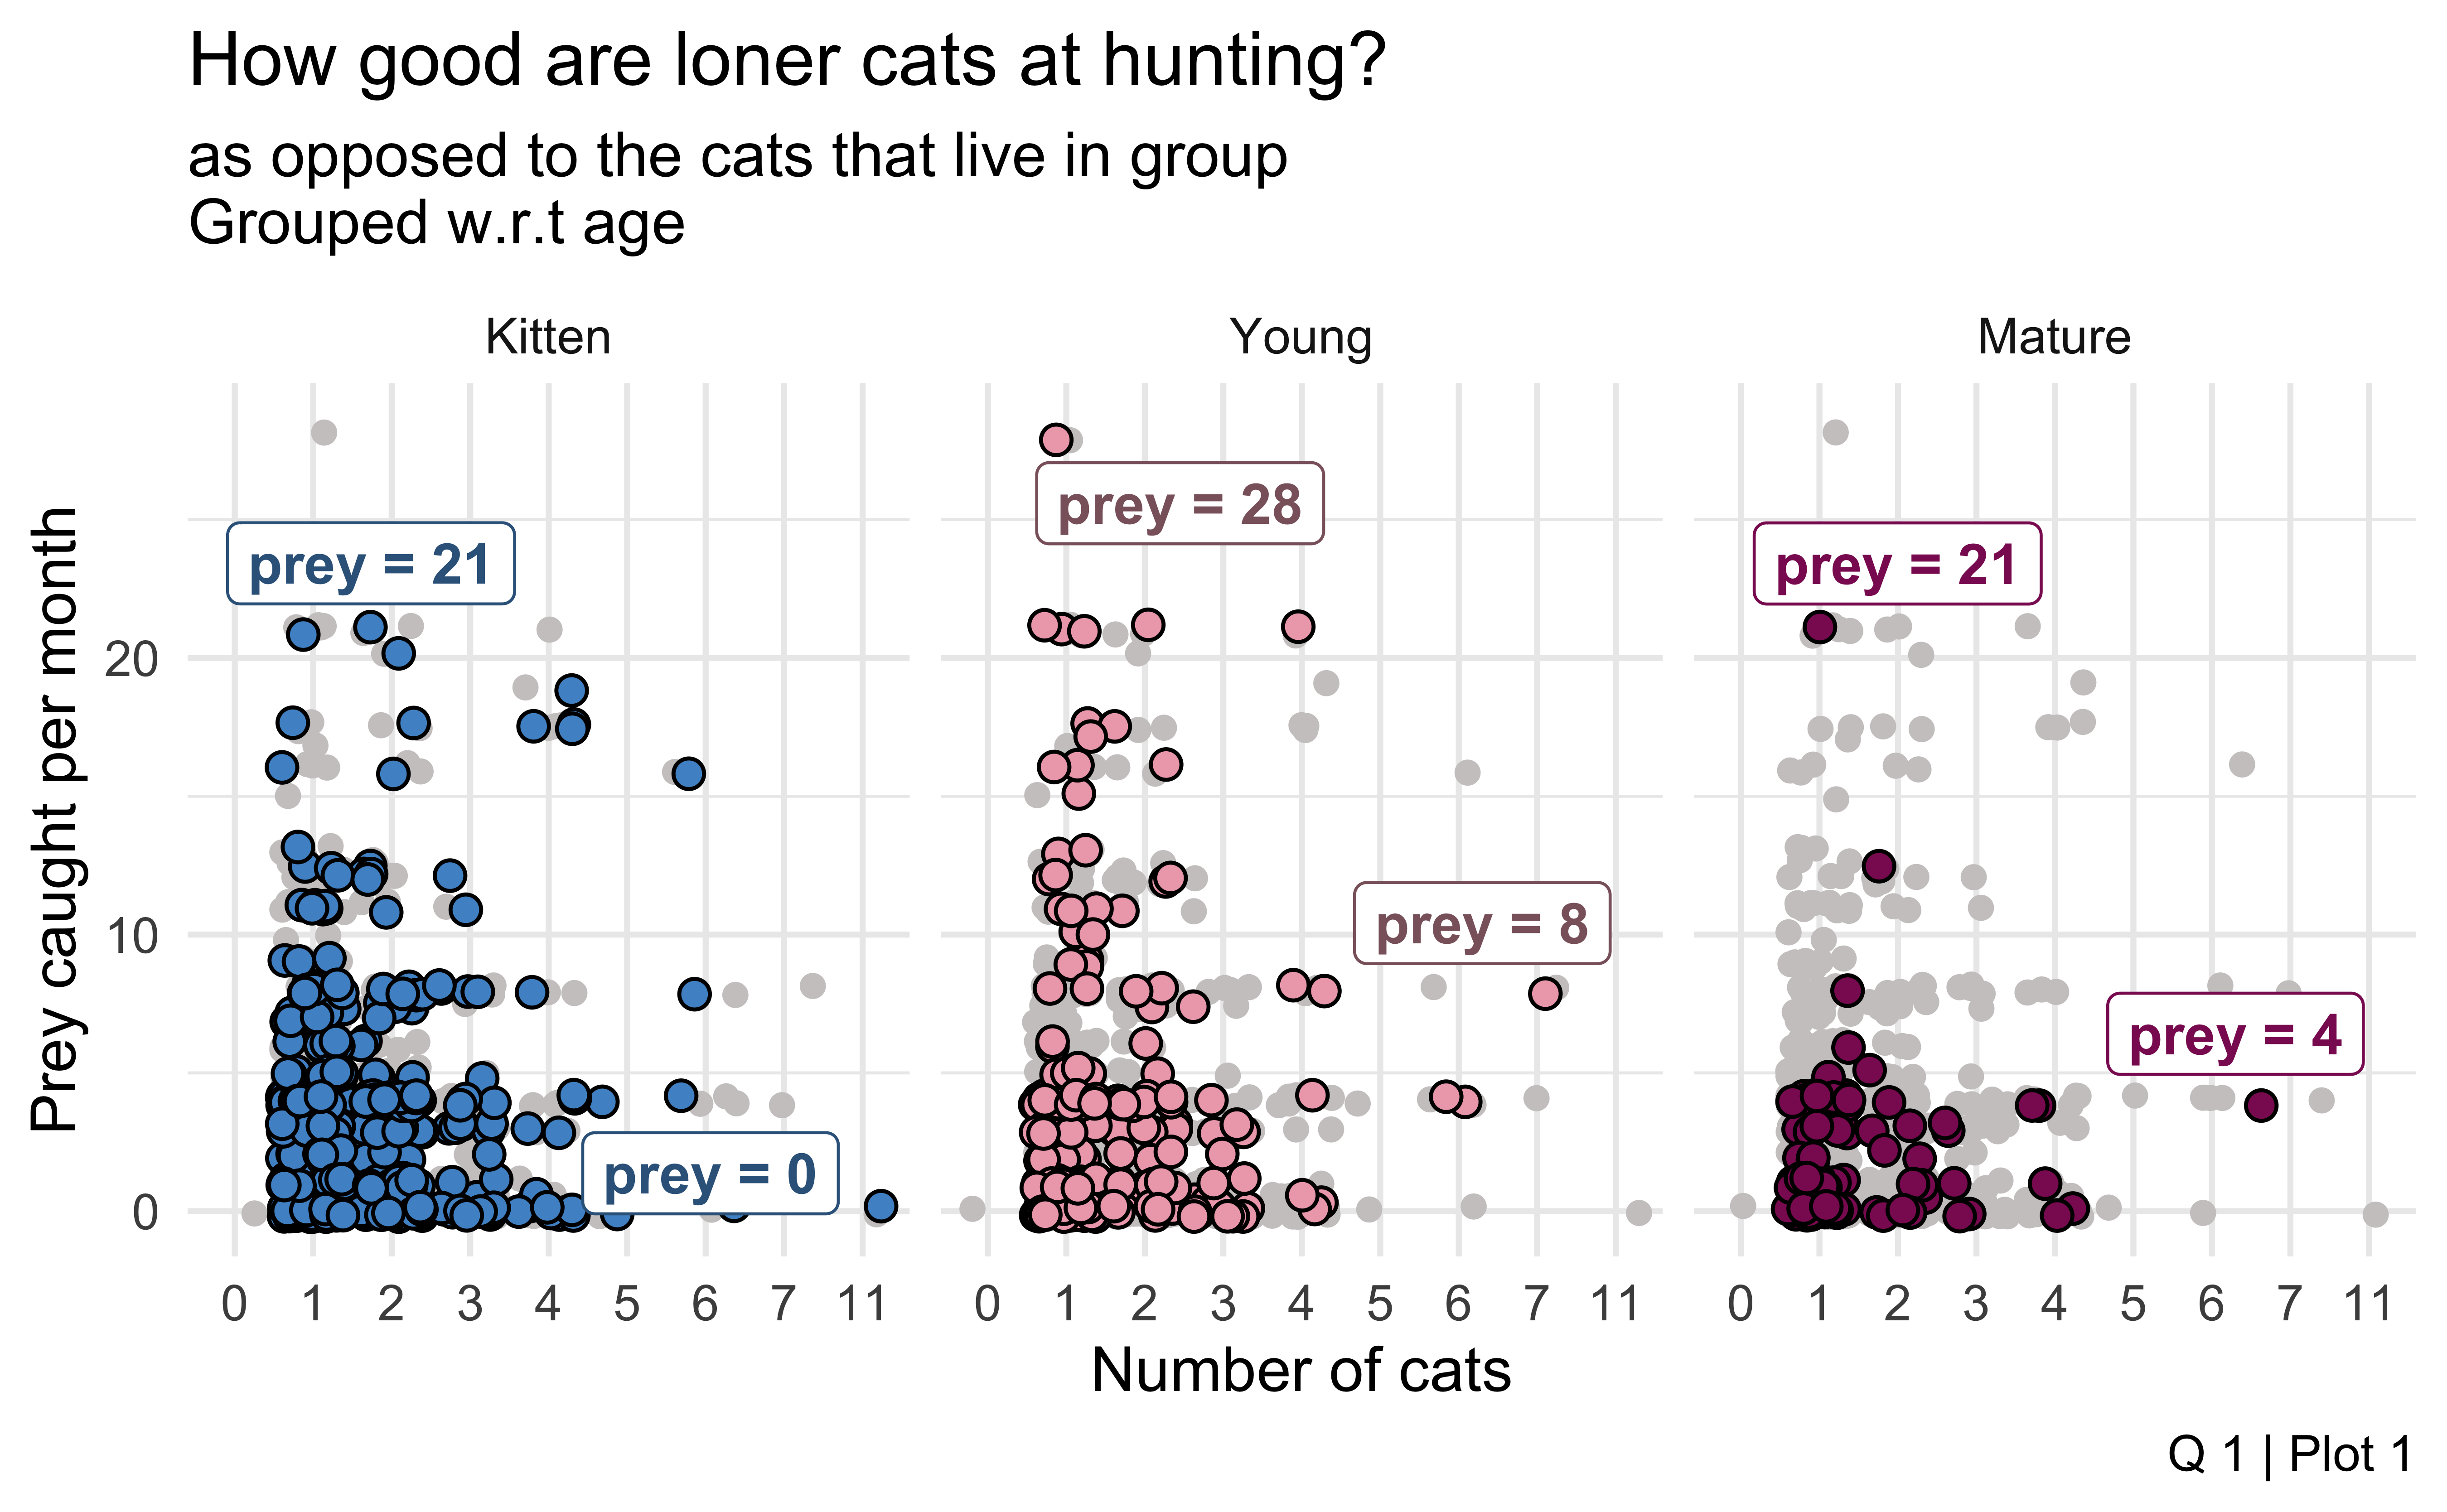
Jitter plot with pray caught per month by the number of cats living together
Cats have been categorized based on their age group
Plot 2
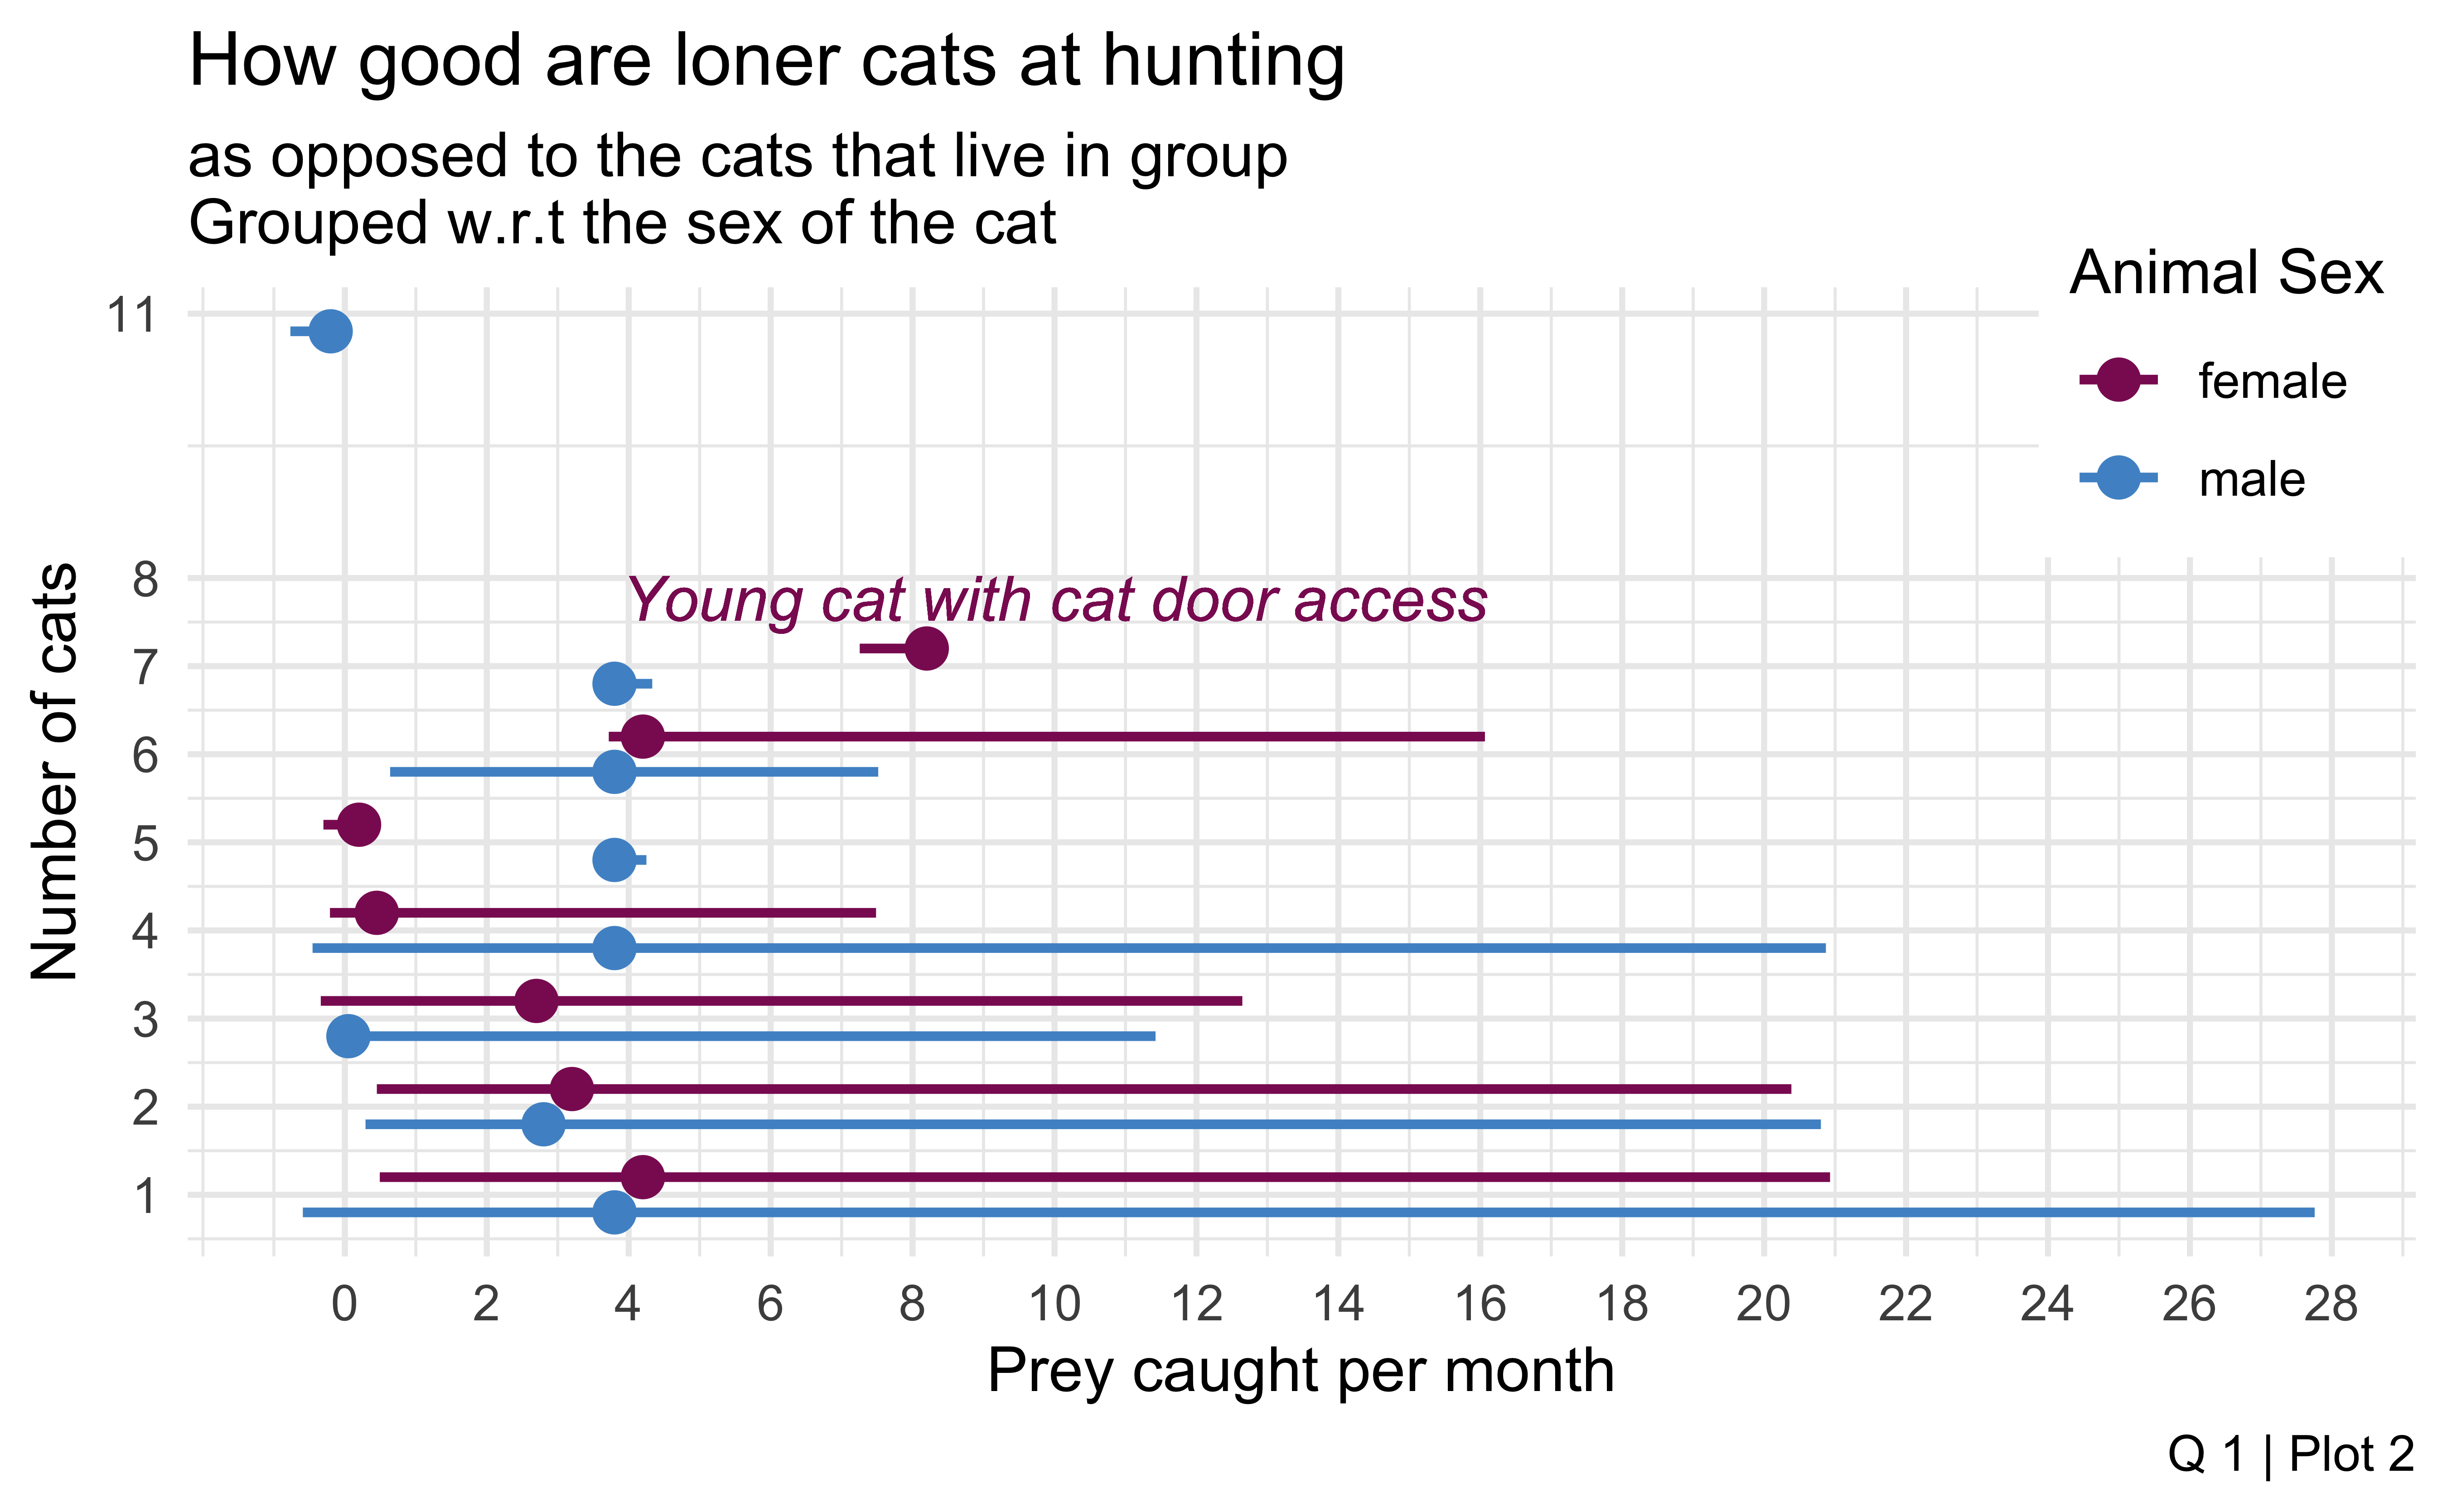
- Line plot with pray caught per month by the number of cats living together
- Cats have been categorized based on their sex
Plot 1
Plot
Insights
Kittens excel in hunting , especially when living alone or in pairs, capturing between 10 and 20 prey monthly.
Hunting efficiency declines as group size exceeds two, particularly among young cats which often capture less than 10 prey monthly.
Mature cats show varied hunting success rates, with a broad spread in the data.
Plot 2
Plot
Insights
The plot compares the hunting efficiency of loner cats to those living in groups, categorized by sex (male and female).
The plot shows that male cats have a higher hunting spree compared to female cats. The average prey caught by male cats is steady with increase in their grouping, whereas female cats tend to hunt less as the number of cats increase.
Young cats having access to a cat door tend to catch more prey than those without, indicating the importance of outdoor access for hunting.
The spread of data points suggests variability in hunting abilities among both male and female cats.
Q2. How does the reproductive status of cats influence the hunting pattern?
Plot 1
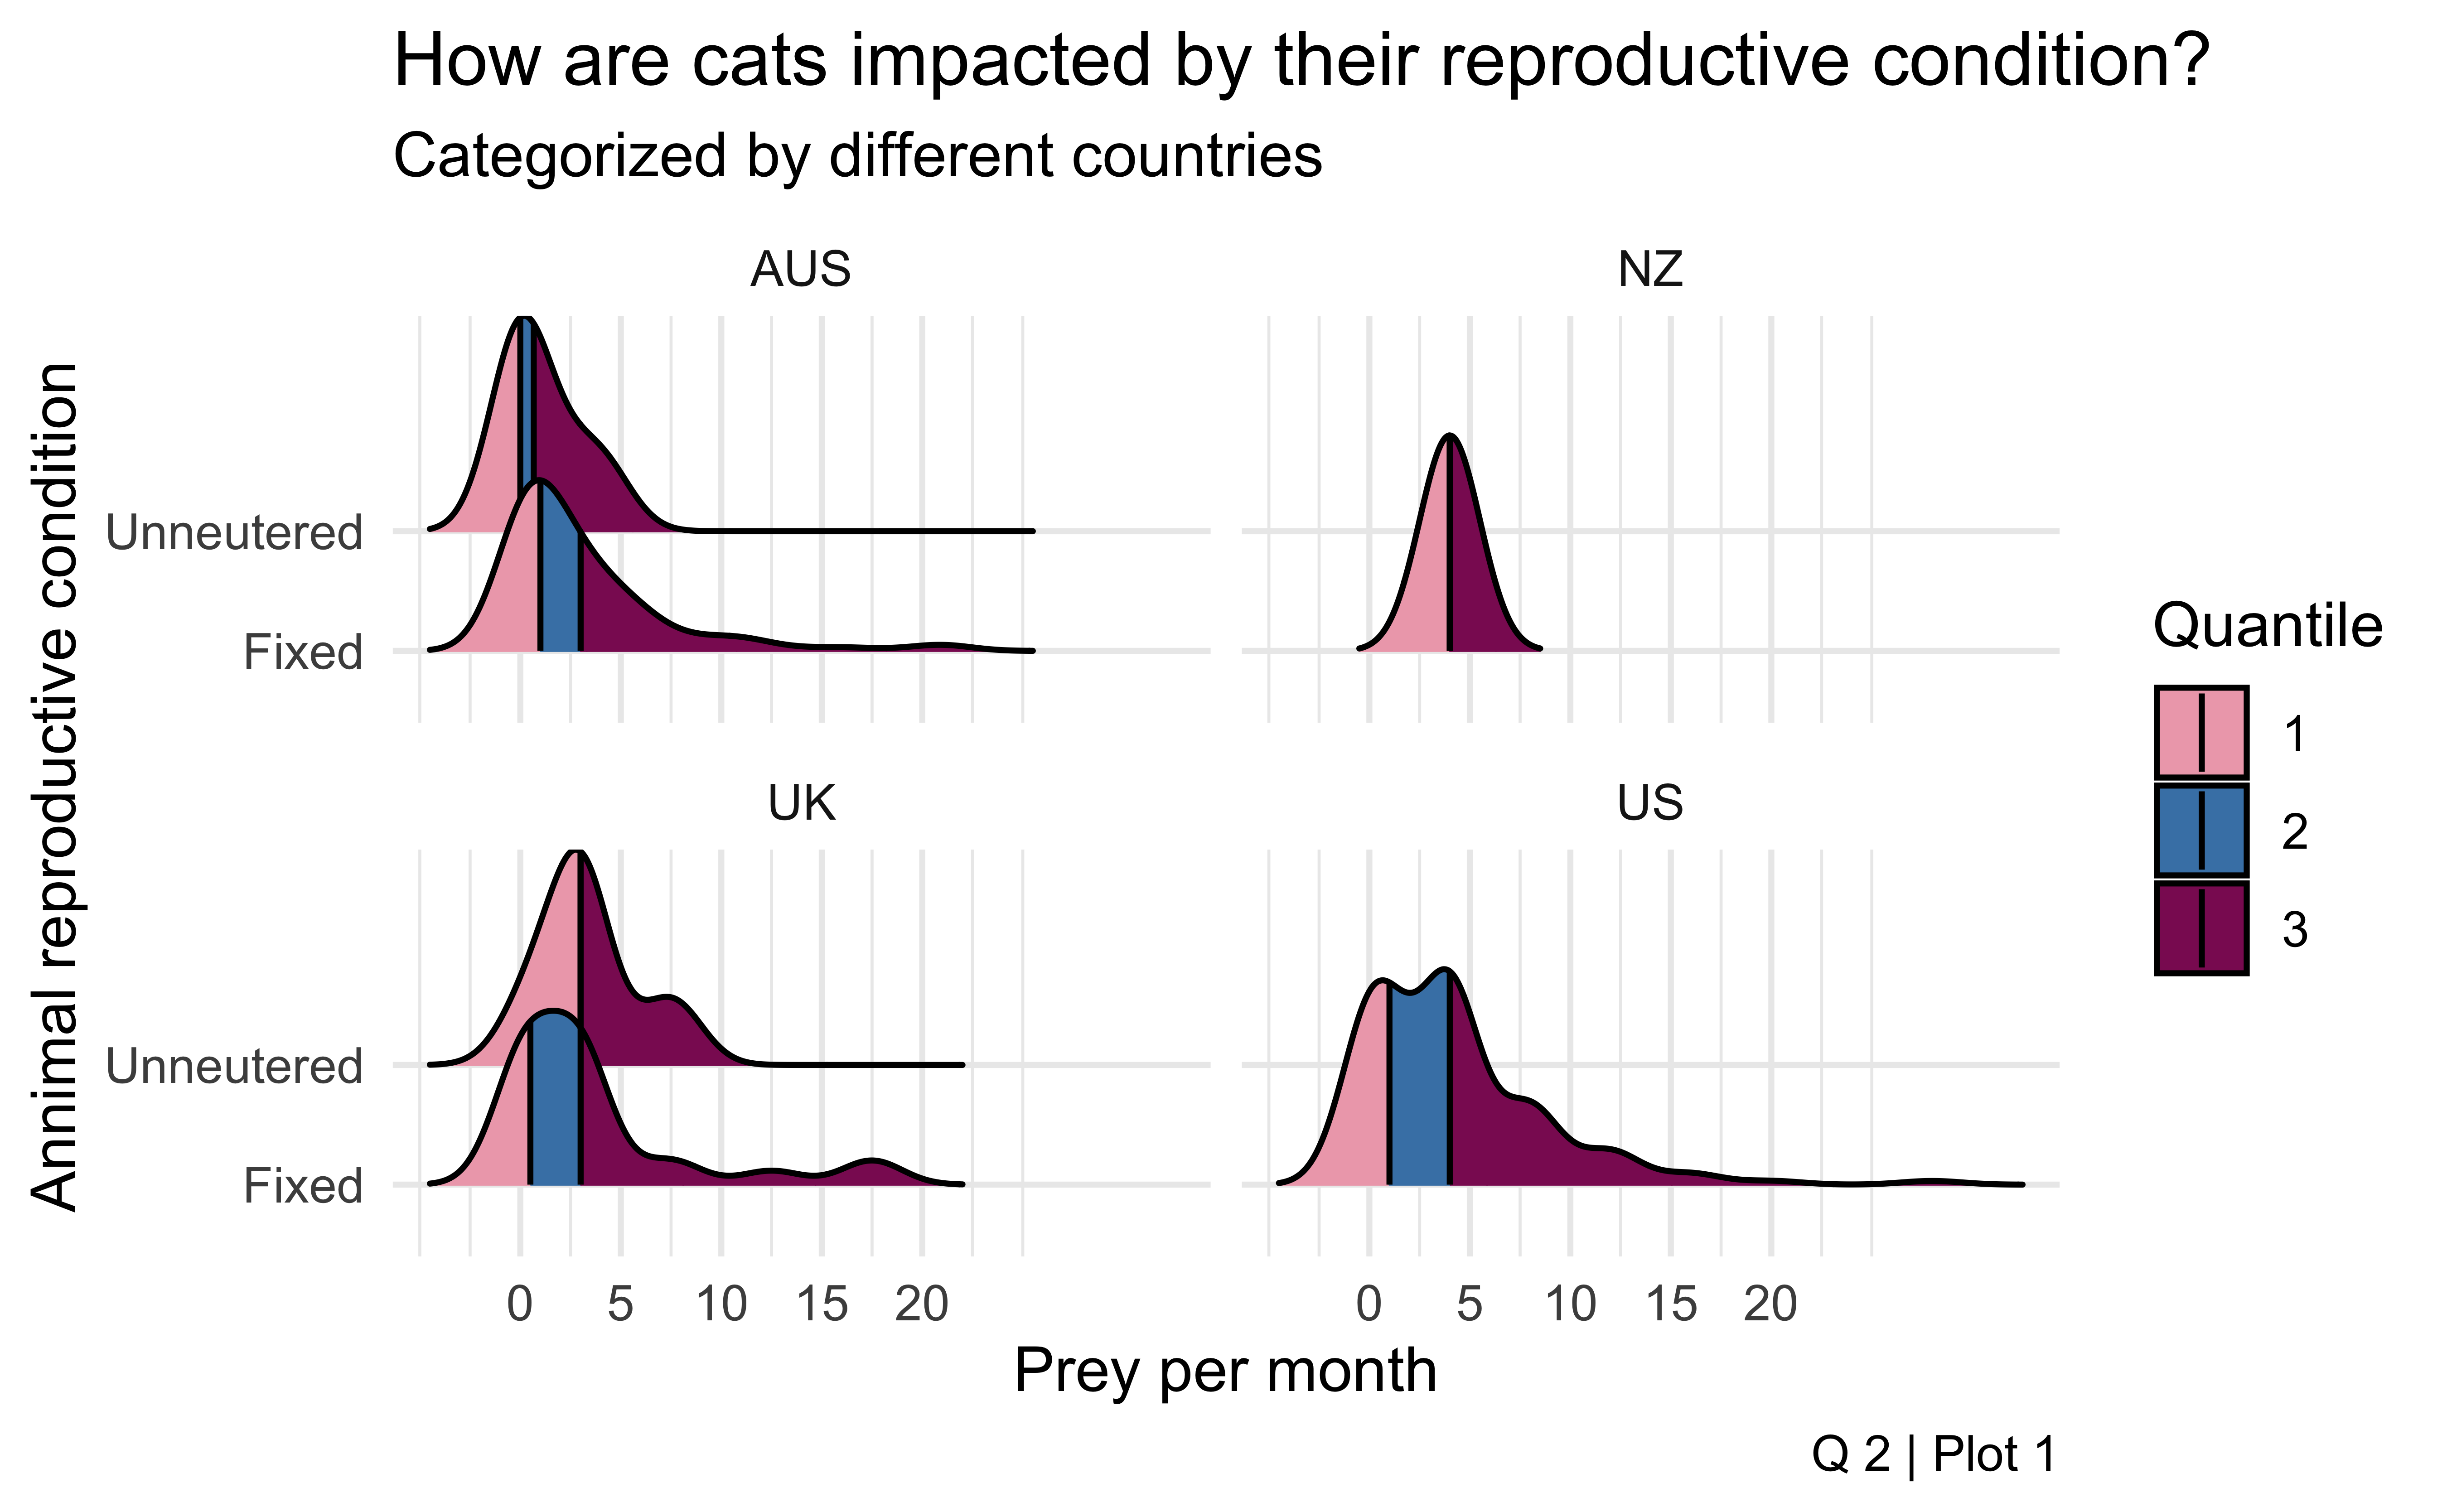
A density ridge plot with animal reproductive condition with prey caught per month
Categorized by country
Plot 2
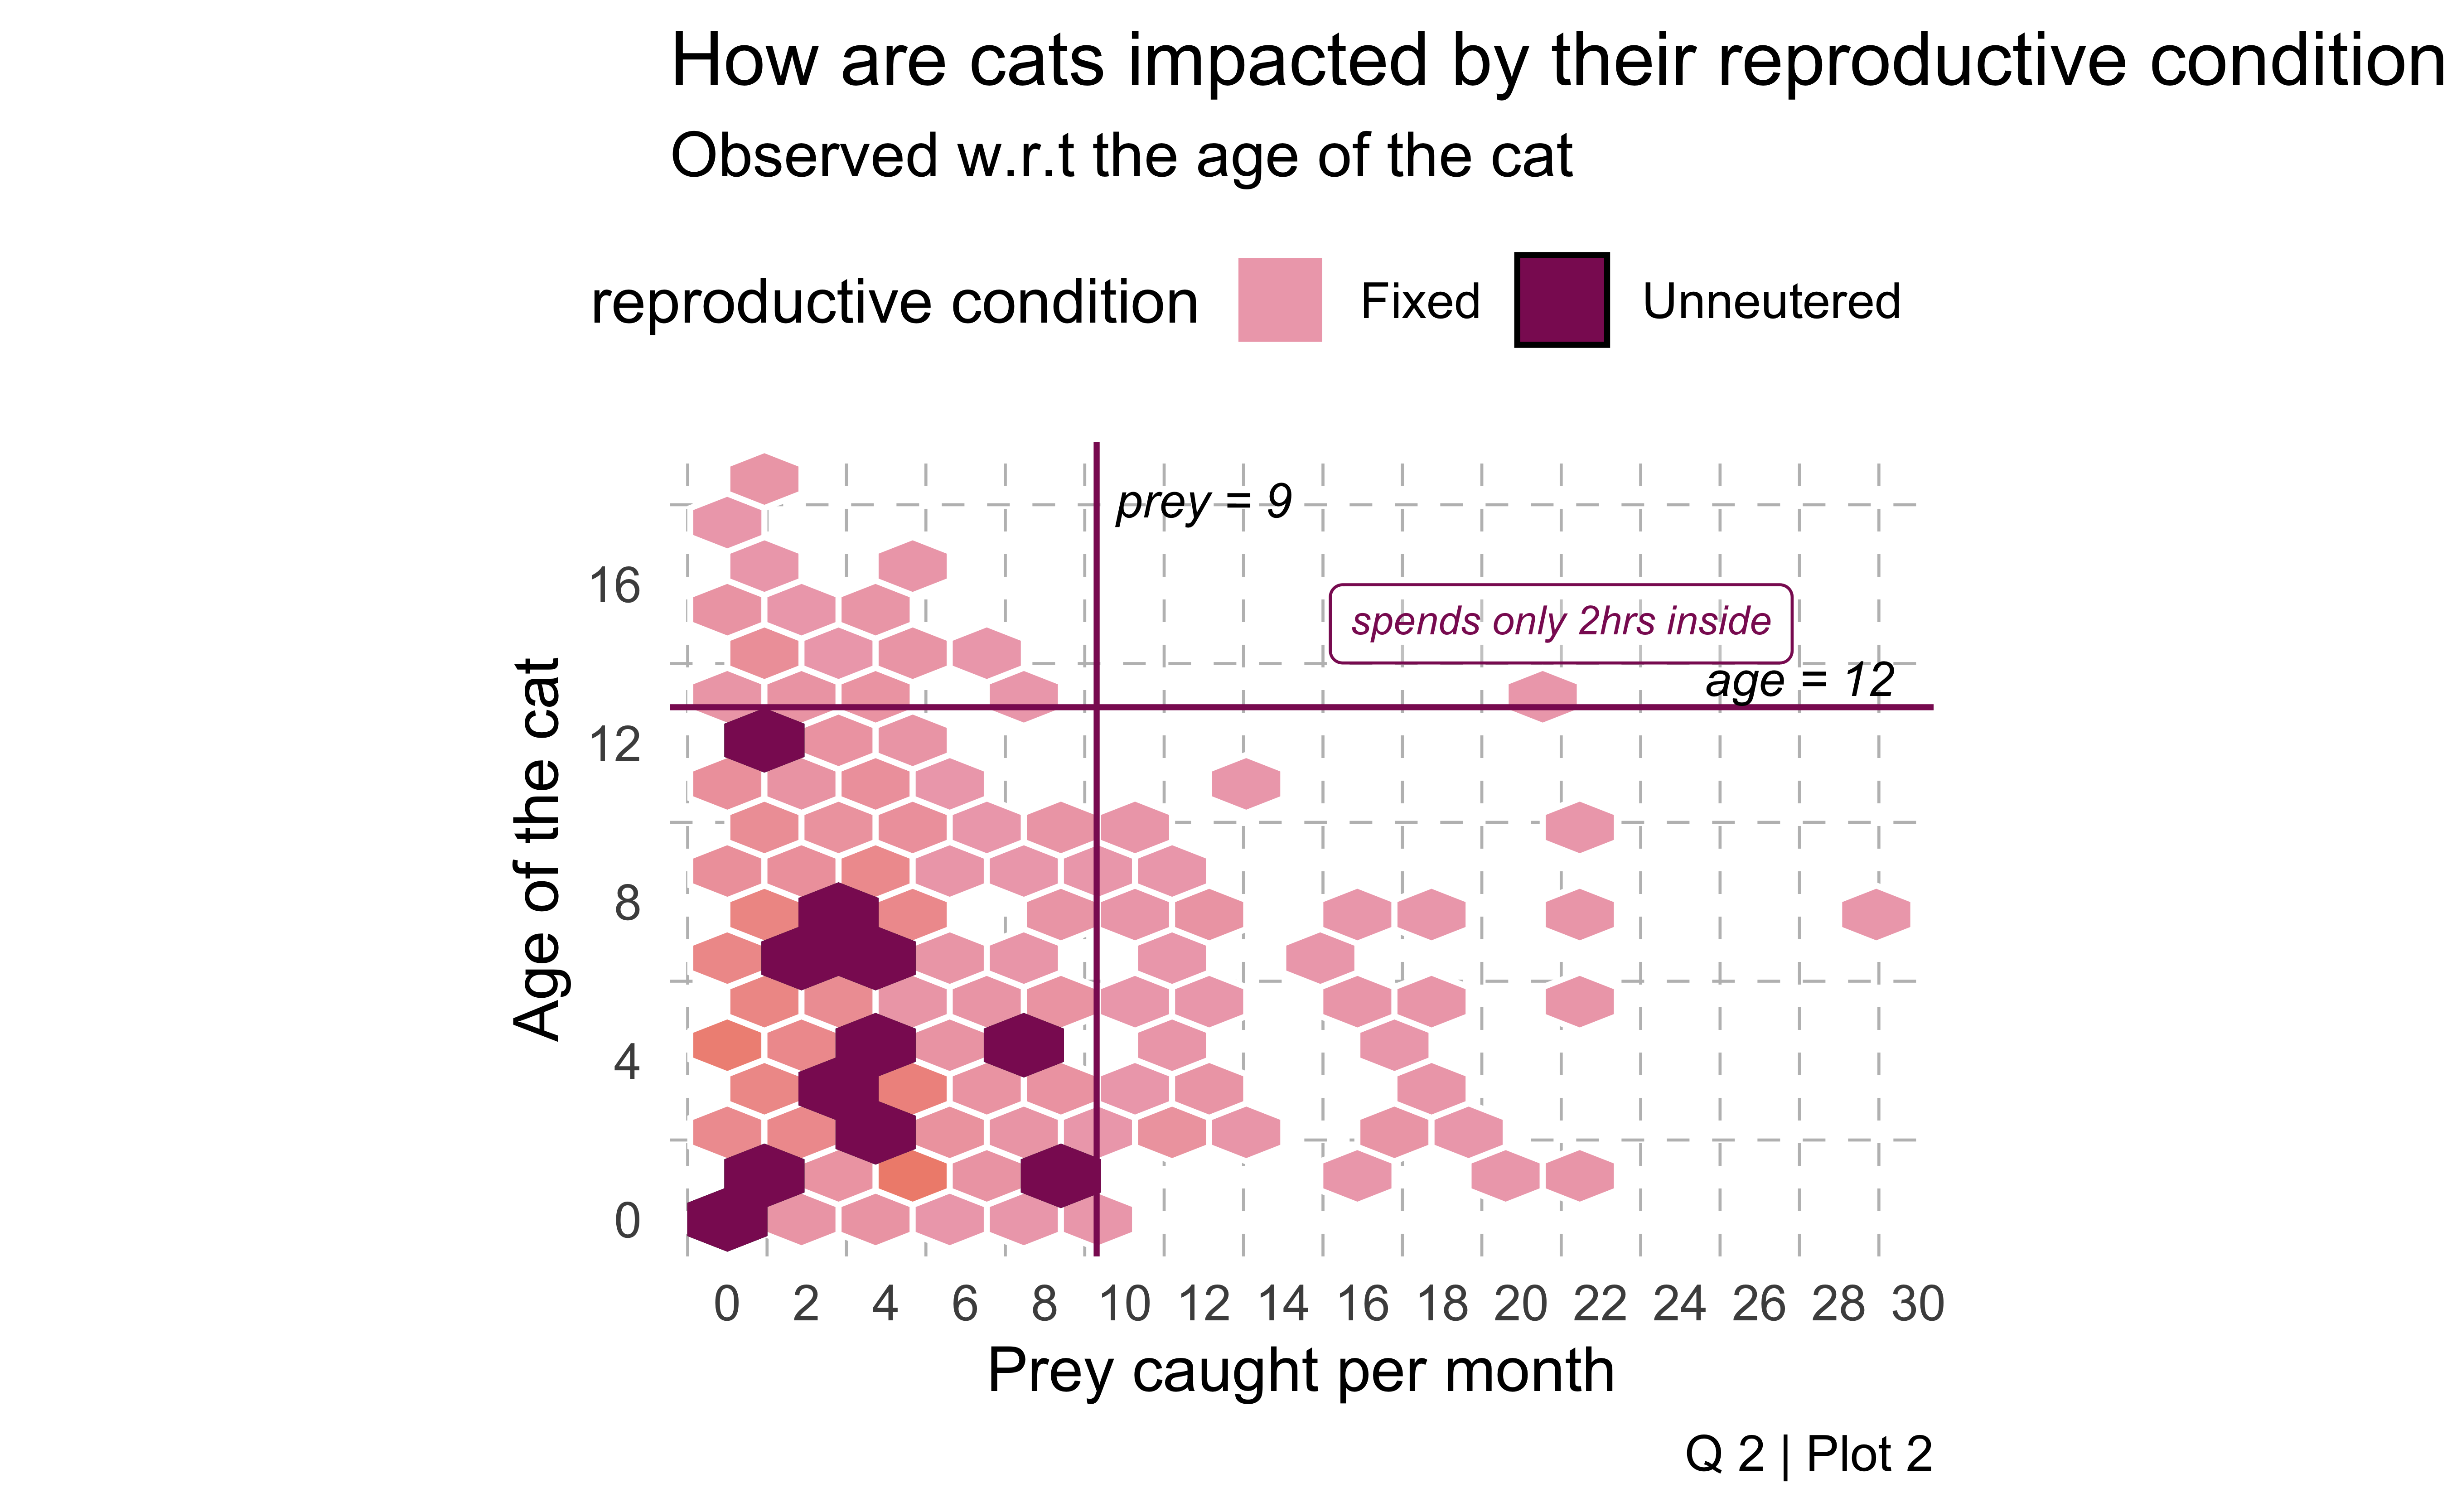
Age of the cat with prey caught per month
Categorized by animal reproduction condition
Plot 1
Plot
Insights
The graph shows a clear distinction in hunting behavior across different countries. Cats in the US and UK tend to catch less prey per month compared to their counterparts in AUS and NZ. This could be due to various factors such as differences in local ecosystems, cat populations, or even cultural attitudes towards outdoor cats.
The reproductive condition of cats seems to have a significant impact on their hunting habits. Fixed cats tend to catch higher amount of prey than unneutered ones. We can see that the first and second quantiles for fixed cats across AUS and UK hold majority of cats than that for unneutered cats. This could be due to hormonal changes or behavioral differences associated with these conditions.
Notably, in the US and New Zealand, data for unneutered cats is absent. Among the displayed data, neutered cats in the US tend to catch slightly more prey.
Plot 2
Plot
Insights
The hunting frequency for cats decline by age immensely when they are unneutered.
The highest prey caught by an unneutered cat is far less than a fixed cat of equivalent age.
Fixed cats are better hunters than unneutered cats by a significant range.
Data is limited on unneutered cats over 12 years old, suggesting they might hunt less or are underrepresented in the study.
Wrap up
Conclusion
Cats that live in group have a lower hunting spree compared to loner cats. Reasons might be old age, unavailability of cat doors or easy access to food and care by a cat-loving owner.
When it comes to their reproductive condition, Fixed cats show a high spree for hunting compared to Unneutered cats.
Although age is a major factor in a cat’s hunting abilities, fixed cats manage to hunt more than the unneutered cats of equal age.
There weren’t much cats in NZ and US that were unneutered, which holds our insights back from exploring their hunting behavior for the said conditions.
Challenges faced
Our initial analysis plan included exploring ground speed while hunting for every individual cat in the dataset. Later it was discovered that there is no information on ground speed for cats in New Zealand. This would have been an interesting correlation.
The lack of data on unneutered cats (owing to the strict neutering policies in some countries) made the insights on the hunting pattern for unneutered cats too limited.
There were major chunk of missing values in the dataset coming from New Zealand and Australia. It was handled by imputation techniques. The veracity for the technique is tested by implementing various models and implementing data sampling to get accuracy in the process.
The variables that could be a part of the analysis were less. Hence, coming up with a combination of variables that accurately depict our insights was a challenge.
There were specific outliers in the data which needed to be explained, in order to justify the relations derived from the dataset. There were additional notes in the raw dataset that helped in analyzing the outliers of the data. The outliers are explained with annotations respectively.