# A tibble: 10 × 6
   variables   types     missing_count missing_percent unique_count
   <chr>       <chr>             <int>           <dbl>        <int>
 1 name        character             0           0            45716
 2 id          numeric               0           0            45716
 3 nametype    character             0           0                2
 4 recclass    character             0           0              455
 5 mass (g)    numeric             131           0.287        12577
 6 fall        character             0           0                2
 7 year        numeric             291           0.637          266
 8 reclat      numeric            7315          16.0          12739
 9 reclong     numeric            7315          16.0          14641
10 GeoLocation character          7315          16.0          17101
# ℹ 1 more variable: unique_rate <dbl>Visualizing Space
An Interactive Spatio-Temporal Visualization of Meteorites Discoveries
Data Dynamos - Deema, Rahul, Swati, Ansh & Shakir
Introduction:
- Meteorites are like celestial time capsules, encapsulate the enigmatic history of our solar system.
- Our initiative introduces an interactive platform sourced from NASA’s Meteorite Landings, aiming to unveil the enthralling saga of these cosmic wonders.
Goal and problem statement:
Our Shiny app features three key visualizations—world map, density map, and bubble map—showcasing meteorite landings across regions, offering insights into their distribution, density, and mass significance.
The question we will be answering is- “What are the noticeable trends in meteor impact on Earth?”
Execution of plan:
Plotting of individual impact of meteor with various parameters like- mass and year.
Integration into an R Shiny application.
Revision and building on responsiveness of plot.
Data Overview:
- Data source: NASA’s Meteorite Landings dataset.
- Data Scope : Name, Recclass, Mass (g), Fall, Year
Data pre-processing:
For our pre-processing, we have done the following:
Dropped all the missing values to a get a new row value of 37,417.
Filtered for mass greater than 1, as there were lot of values close to 0.
Renamed and cleaned names of columns.
Plots
Point plot:
1). Which continents appear to have the highest density of meteorite impacts based on the data visualized in the provided plot?
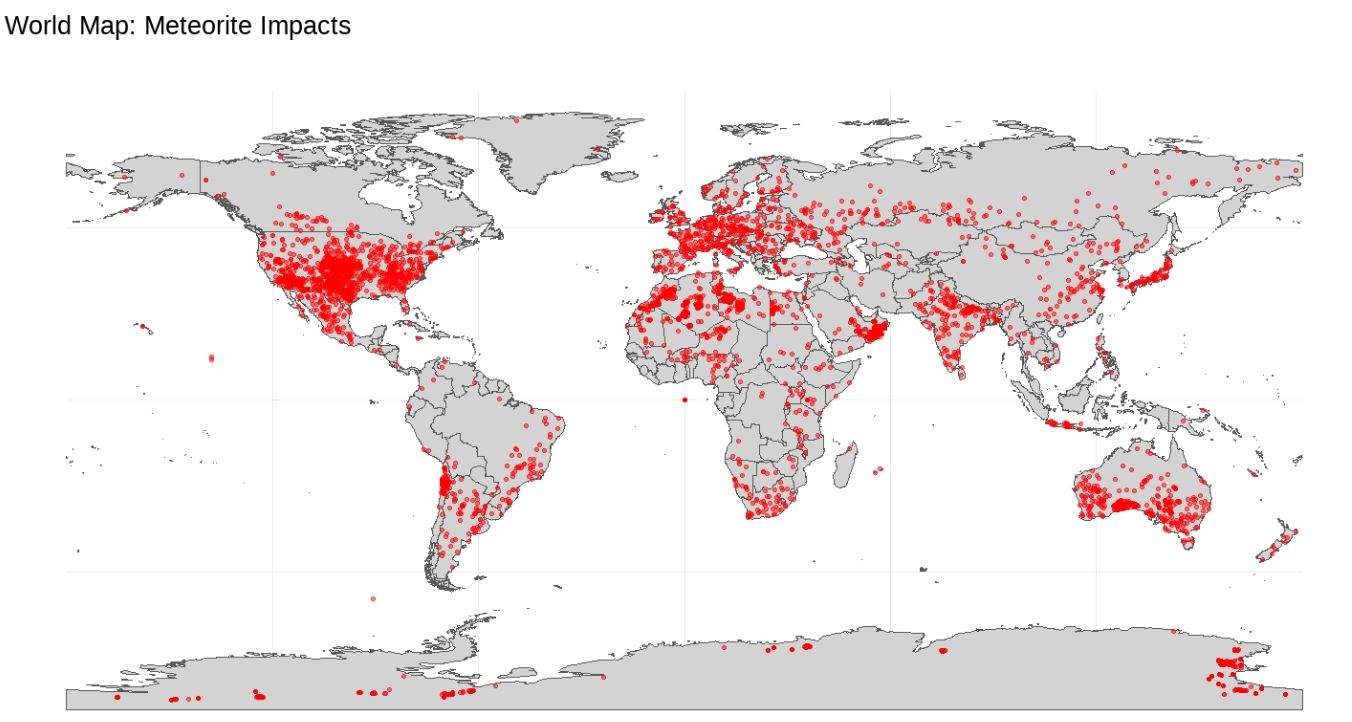
Point plots:
High Impact Density: Europe and North America show a high density of meteorite impacts.
Moderate Impact Density: Parts of Asia and Africa display a moderate concentration of impacts.
Lower Impact Density: South America and Australia have fewer impacts compared to Europe and North America.
Minimal Impact Reporting: Antarctica has the least number of recorded impacts, potentially due to underreporting.
Density plot:
2). What does the thermal map suggest about the geographical distribution of meteorite impacts across the world?
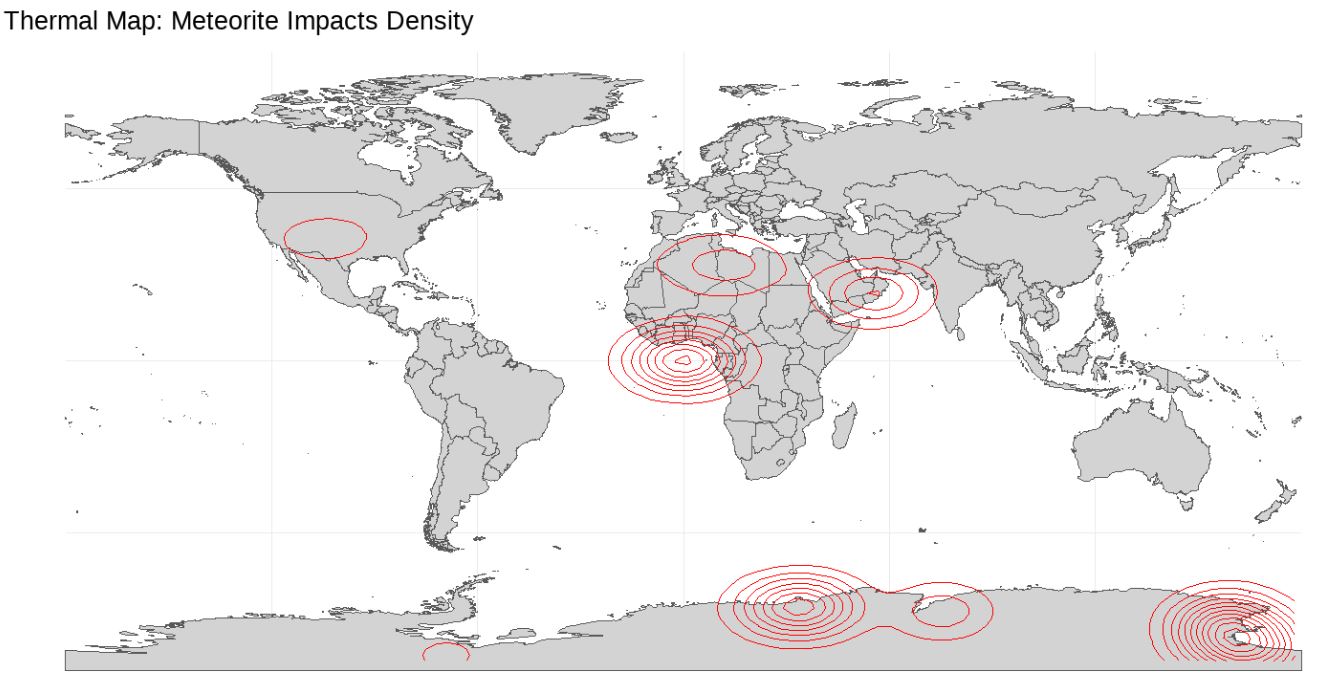
Density plot:
Concentrated Zones: The map highlights areas with a significant concentration of meteorite impacts through thermal rings.
Major Impact Regions: Regions with the densest meteorite activity include parts of North America, Europe, and Asia.
Secondary Impact Zones: Lesser concentrations are visible in South America, Africa, and Australia. Oceans and Antarctica: The map shows minimal impact activity in the oceans and Antarctica. Data
Interpretation: The thermal rings suggest areas where meteorites are most commonly found or reported. Reporting Bias: The concentration of impacts may be influenced by the ease of meteorite discovery and reporting mechanisms in different regions.
Bubble plot:
3). How does the mass of meteorites vary across different regions of the world?
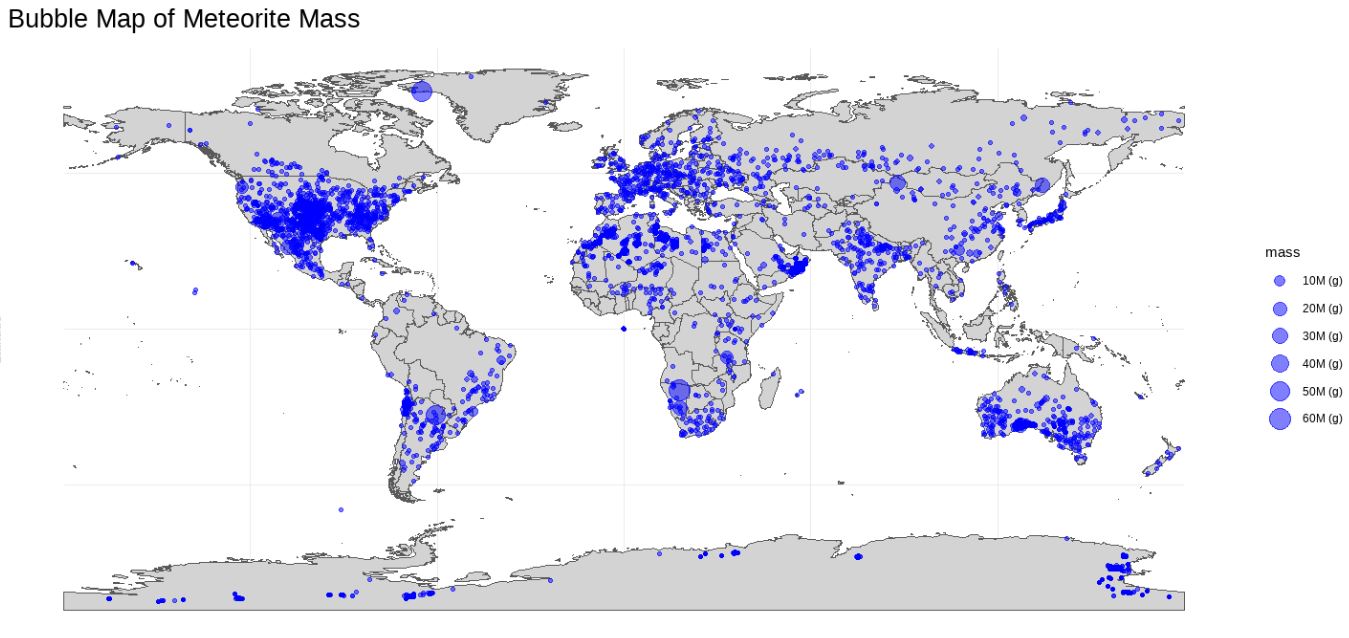
Bubble plot:
Variation in Mass: The map shows a variation in meteorite mass with some regions exhibiting larger meteorites than others.
Larger Meteorites: Regions with notably larger meteorites, as indicated by bigger bubbles, include parts of North America, Europe, and Asia. Smaller Meteorites:
Smaller meteorites, represented by smaller bubbles, are widely scattered across all continents.
Mass Concentration: There is a concentration of larger meteorite masses in the northern hemisphere.
Oceanic Impacts: Fewer large meteorites are noted in the oceans, likely due to the difficulty in discovering them.
Designing the Shiny App:
User Interactivity Features:
Temporal Analysis
Spatial Distribution
Size and Classification Analysis
R Shiny application:
Impact and Applications:
- This visualization serves as an engaging educational tool, aiding astronomy enthusiasts, students, and researchers in understanding meteorite impacts’ global distribution, sizes, and densities.
- Researchers can leverage this visualization to conduct in-depth studies on meteorite falls over time, identifying trends, hotspots, and variations in impact frequencies across different periods and regions.
Future Enhancements:
Introducing a feature that allows users to access in-depth meteorite details simply by hovering over impact sites on the map.
This enhancement will provide immediate access to essential specifics such as meteorite names, formation years, and other crucial attributes, facilitating deeper insights into each meteorite.
Challenges:
Data Limitations: Addressing the challenge of underrepresented areas due to lack of reporting or discovery, especially in remote regions.
Technological Barriers: Overcoming technical limitations in handling and processing large datasets with high accuracy.
Public Engagement: Ensuring the Shiny app remains user-friendly and engaging for a diverse audience, encouraging public interaction and education.
Conclusion and Q&A.
Global Distribution: The data and visualizations reveal a global distribution of meteorite impacts, with varying densities and masses.
Density Concentration: Impact density is higher in populated regions, suggesting better reporting or more extensive discoveries due to human activity.
Mass Observations: Larger meteorite masses are found sporadically, with notable occurrences in the Northern Hemisphere, particularly North America, Europe, and Asia. Visualization Effectiveness:
The Shiny app effectively visualizes complex data, allowing for interactive exploration of meteorite impacts by year and mass.