From Takeoff to Touchdown: Dissecting Data on Air Disasters
INFO 526 - Fall 2023 - Project Final
Infographic Innovators - Antonio, Bharath, Eshaan, Thanoosha
School of Information, University of Arizona
Objective
Conduct an in-depth analysis of aircraft crashes within the United States to uncover temporal trends and geographical patterns.
Background
Dataset procured from the National Transportation Safety Board (NSTB).
Contains records of aircraft crashes in the U.S. from Jan 1, 1980, to Dec 31, 2022.
Originally comprised 89,134 rows and 38 columns, refined to 20 columns for focused analysis.
Value
Enhance understanding of aviation safety and factors contributing to aircraft crashes.
Personalize insights based on diverse experiences with air travel.
Questions Proposed
What are the aircraft crashes’ locations, timings, and consequences?
What contributes to the crashes, and does weather significantly impact the increase in aircraft crashes?
Navigating Through the Timeline of Flight Incidents
Time-Series Analysis
Choropleth Map
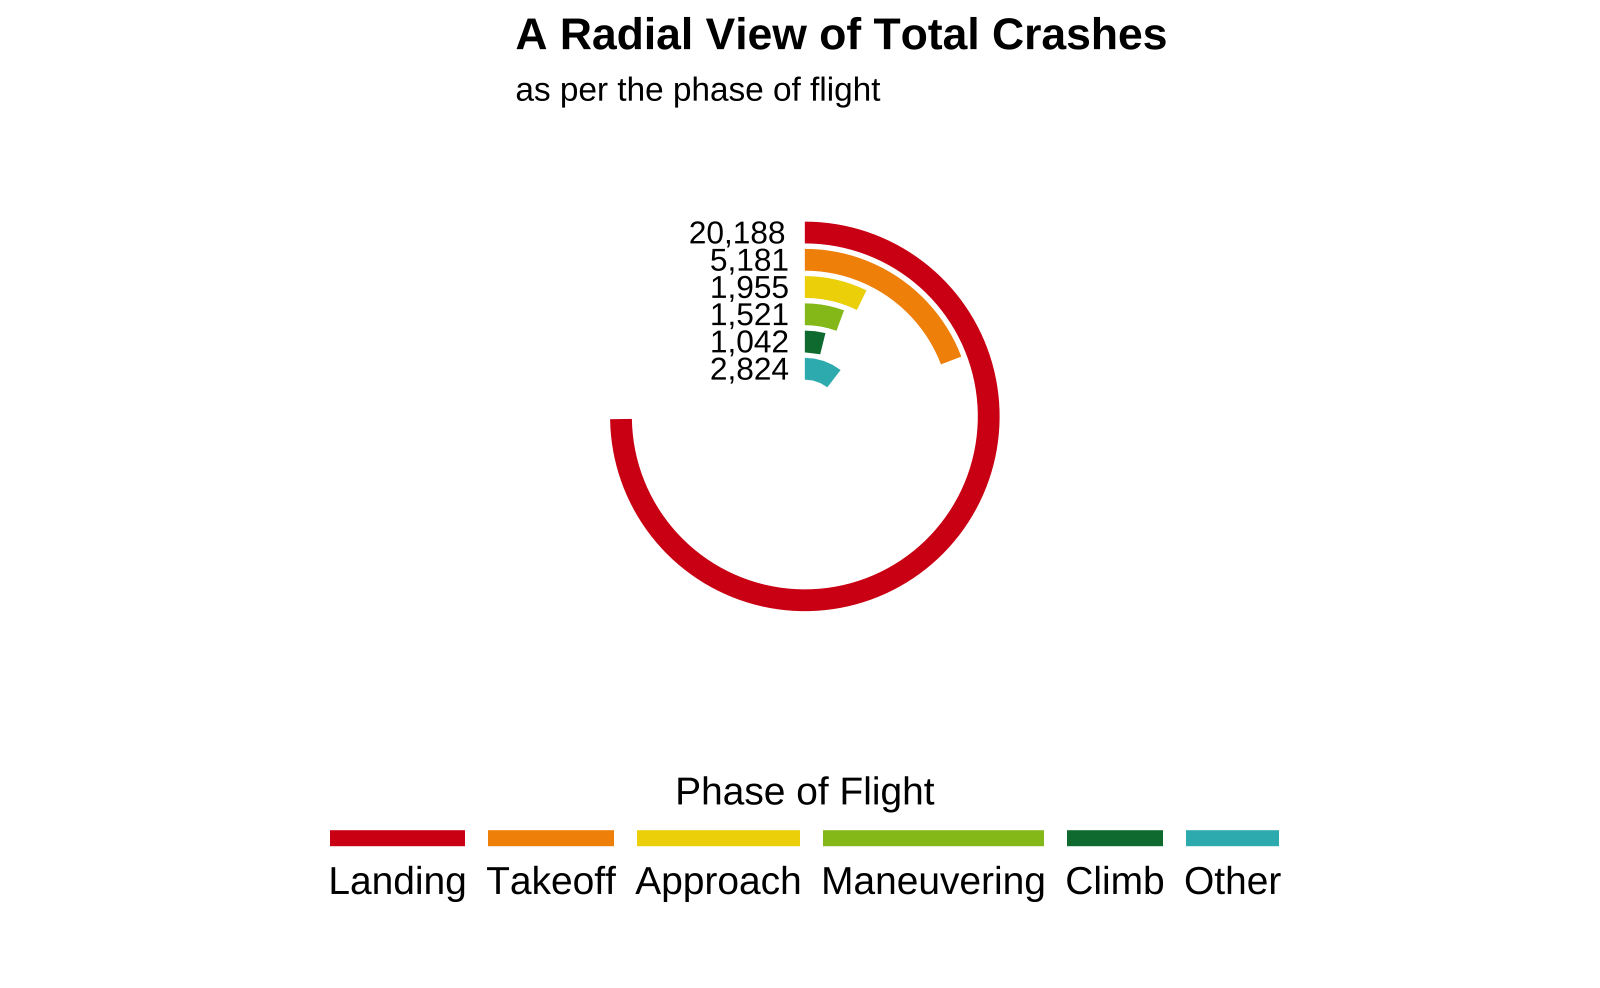
Radial Bar - Total Crashes
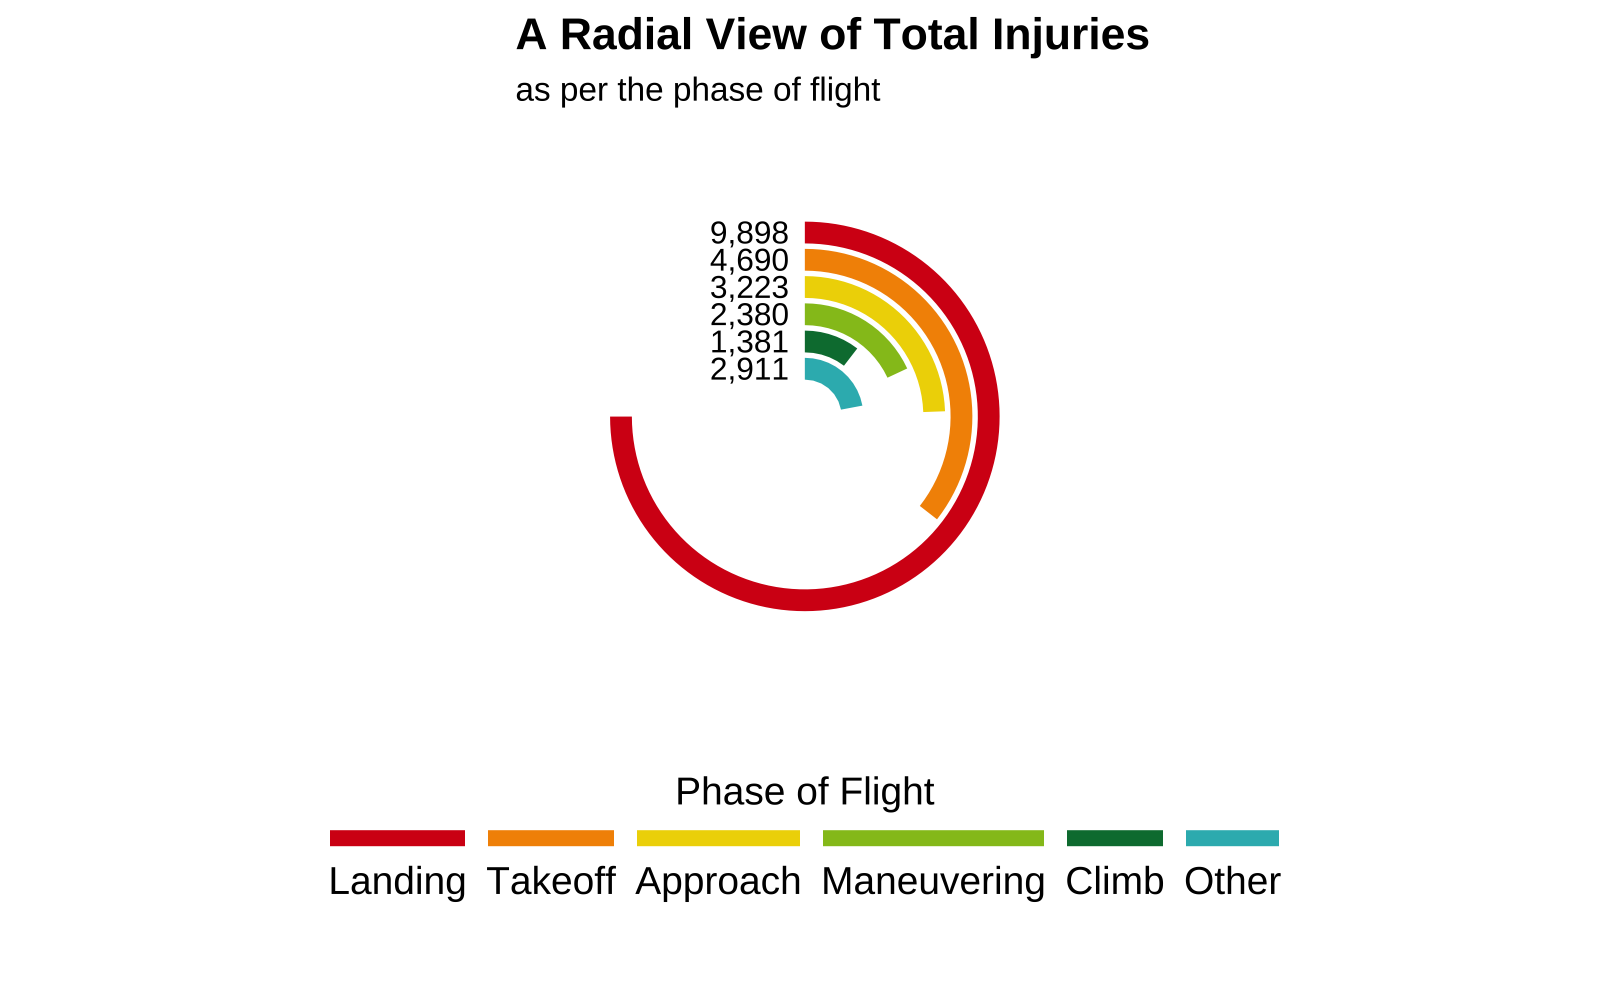
Radial Bar Plot - Total Injuries
Analysis of Causes of Crashes
Waffle Chart
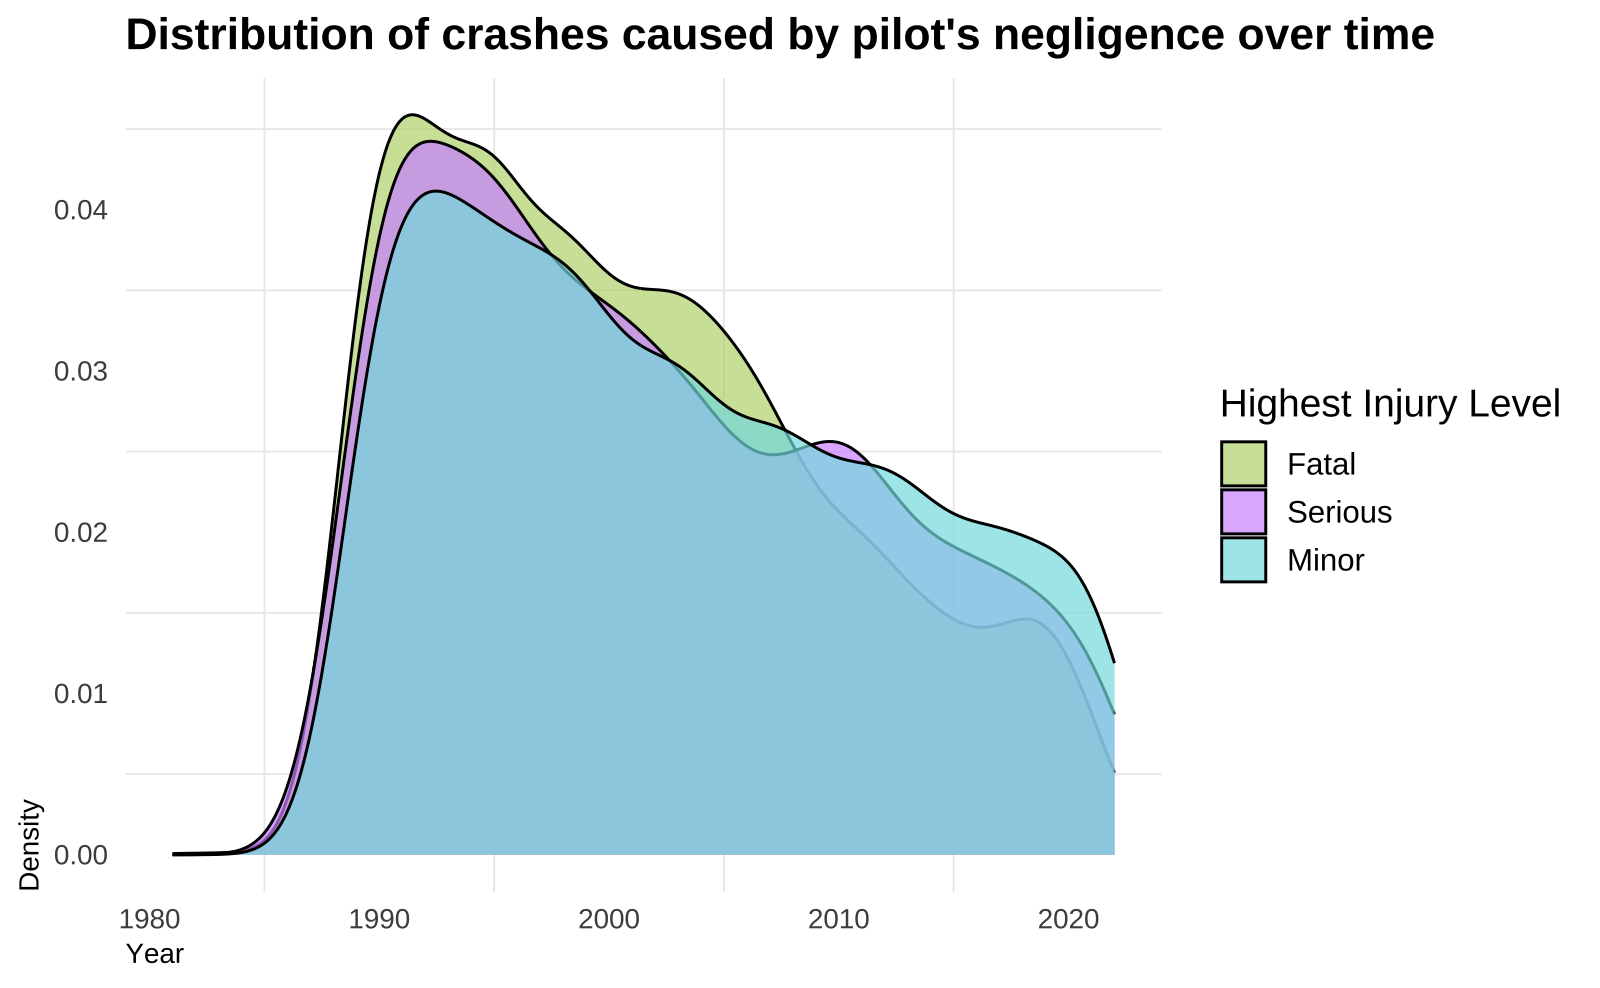
Density Plot
Assessing the Influence of Weather Conditions on Crashes
Radar Plot
Here, VMC stands for Visual Meteorological Conditions and IMC stands for Instrument Meteorological Conditions.
Conclusion
- Annual crash occurrences remain notable, but a declining trend is observed over the decades from 1980 to 2022.
- The decline in fatalities over time underscores the effectiveness of safety measures and protocols implemented in the aviation sector.
- Shiny App - From Takeoff to Touchdown: Dissecting Data on Air Disasters
Problems Faced
- Lot of information from the to process and visualize.
- The obtained dataset was partially skewed which made it harder to normalize certain metrics for visualization.
- Performing Data Wrangling on the dataset was difficult as it was of size
89,134 rows and 20 columns. - But, because the dataset was vast, we could also create multiple visualizations which we could present for this project.
Future Scope
- Exploring other countries and finding a credible source for the data.
- Exploring Data and correlating with other credible sources to find the exact reason behind the crash.
- The developed Shiny App can be used as an alternative to the current dashboard which visualizes flight crashes on the
NTSB.govwebsite. - Diving in Deeper into flight crashes and visualizing flight paths and plotting real-time status of flights.
Thank you

![]()